
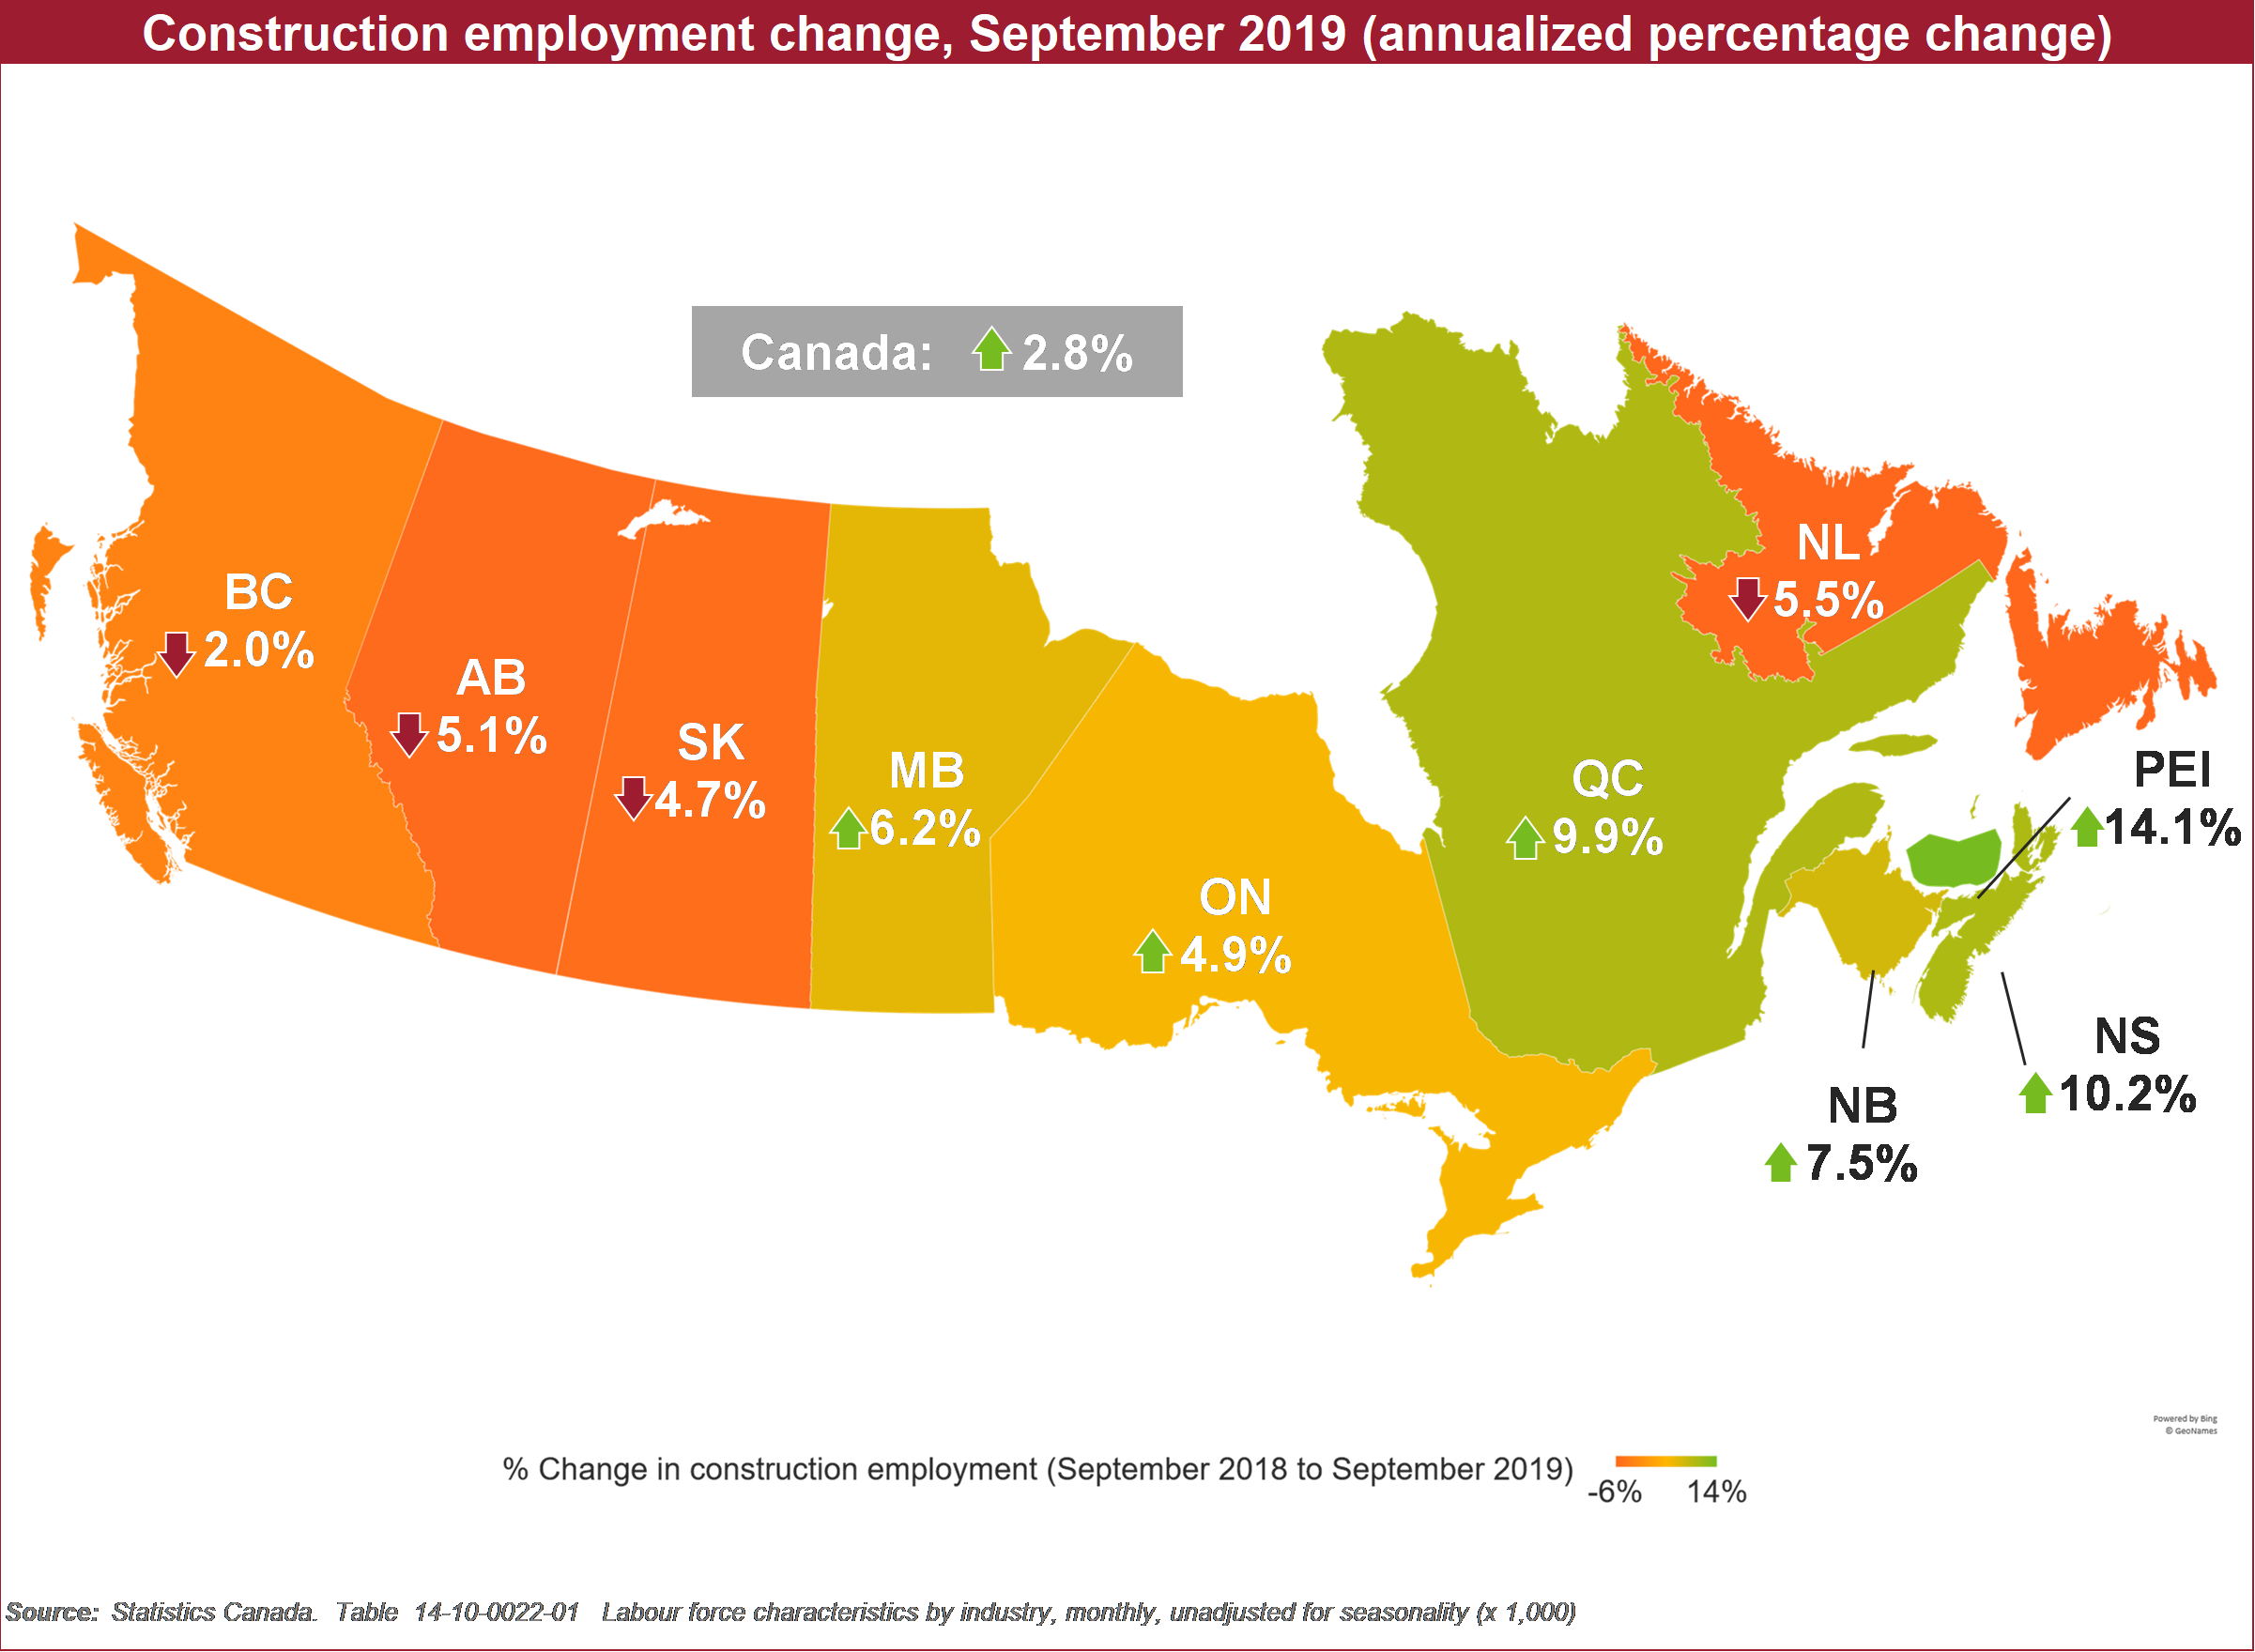
As peak construction season begins to wind down, the latest update from Statistics Canada’s Labour Force Survey (LFS) reveals strong gains in both employment and the size of the labour force in September 2019. When compared to the same month in 2018, Canada’s construction industry added 41,700 (+2.8%) jobs, while the labour force surpassed 1.6 million, as 45,700 (+2.9%) workers joined the labour force. However, the unemployment rate for the construction industry remained near record lows at 4.1%.
But the LFS only identifies a worker’s place of residence, failing to capture temporary mobility across provinces, and making it difficult to decipher some trends in provincial labour dynamics. Statistics Canada’s Survey of Employment, Payroll and Hours (SEPH), on the other hand, captures the employment of workers within a province, but fails to identify those who are self-employed.
Based on the LFS, the Atlantic provinces (excluding Newfoundland and Labrador) experienced strong employment growth in September 2019 compared to the same month in 2018, while employment growth in Ontario came in at under 5%. The SEPH shows more modest growth in the Atlantic provinces and stronger growth in Ontario, which may indicate mobility from East to West.
The LFS also indicates a modest decline in British Columbia, while the SEPH shows employment increases. Employment declines in Alberta and Saskatchewan are more acute in the SEPH and more muted in the LFS, suggesting that displaced workers from these provinces are being absorbed into the BC construction industry.
Data from both the LFS and SEPH agree on Quebec and Manitoba, with both provinces showing signs of good growth.
———
While the BuildForce Canada blog has regularly provided analysis of Statistics Canada’s monthly LFS data, this will be the last regular blog entry to cover these information releases. Our new “Key Indicators” dashboard found on the website landing page now delivers up-to-date construction industry statistics, incorporating LFS reports, sector-specific profiles, and key indicators on housing starts, building permits, and more. While we’ll continue to feature LFS analysis in our blog when monthly reports indicate significant or unusual trends, look to the Key Indicators for regular monthly LFS data updates.