In this five-part series, BuildForce Canada presents and examines some of the key data points emerging from the past 12 months in the construction sector. In this post, the second of the series, we explore how trends in interest rates, targeted policies, and underlying demographics impacted residential construction in 2024.
After a sharp slowdown in 2023, Canada’s residential construction sector began to regain momentum in 2024. Easing interest and mortgage rates, targeted policy supports, and underlying demographics helped stir a modest recovery. But that recovery wasn’t felt evenly across the country. While housing activity surged in some markets, others, particularly Canada’s largest metropolitan areas, continued to slow.
For builders, developers, and workforce planners, these shifting dynamics shed light on where demand is growing, and where labour, permitting, and delivery systems could be tested most in the coming year.
Lower mortgage rates spark renewed activity
One of the most influential developments in 2024 was the Bank of Canada’s pivot toward interest rate cuts. After peaking in 2023, mortgage rates, which tend to be tied to Bank of Canada’s overnight lending rate, began to ease steadily. Variable insured rates fell from a high of 7.7% in July 2023 to 4.8% by year’s end, while five-year fixed rates dropped from 5.6% in November 2023 to 4.2% by December 2024.
This easing had a direct impact on homebuyers’ ability to qualify for and carry new mortgages, restoring confidence and unlocking demand. For residential construction, it meant a green light for projects that had been paused due to tighter financing conditions.
Housing starts rebound modestly
Canada-wide, housing starts climbed to 245,400 units in 2024 – a modest 2% gain following a steep (-22%) decline in 2023. But behind this slight rebound is a deeper transformation in the kinds of homes that are being built.
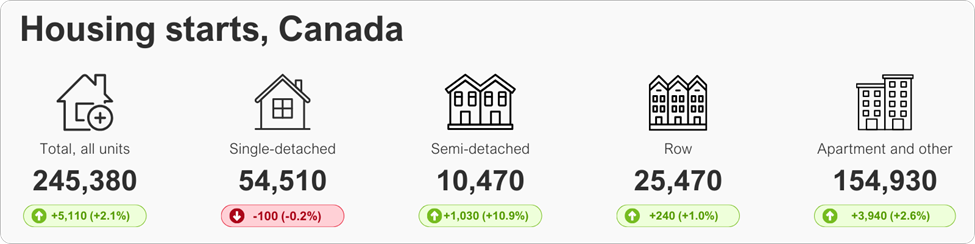
Note: the graphic above shows Canada’s housing starts estimates for 2024 by unit type. The growth indicators represent the 2023 to 2024 year-over-year change, in real terms and percentage.
Source: Statistics Canada. Table 34-10-0135-01 Canada Mortgage and Housing Corporation, housing starts, under construction and completions, all areas, quarterly
Apartment construction, which accounted for 45% of total housing starts a decade ago, rose to 66% of total housing starts in 2024. This trend is a clear signal of the growing pressure on cities to build up – rather than out – and to provide more affordable multi-unit options for renters and families alike.
The growth in purpose-built rentals was especially strong, rising 18% in 2024. This resulted as developers responded to incentives created by the introduction of a 100% GST rebate for these unit types, which made many rental projects more financially feasible. By contrast, condominium construction fell by 16%, partly due to a surplus of unabsorbed units in major urban centres, such as Toronto and Vancouver, and a more cautious investment climate.
Housing starts by unit type, quarterly, Canada
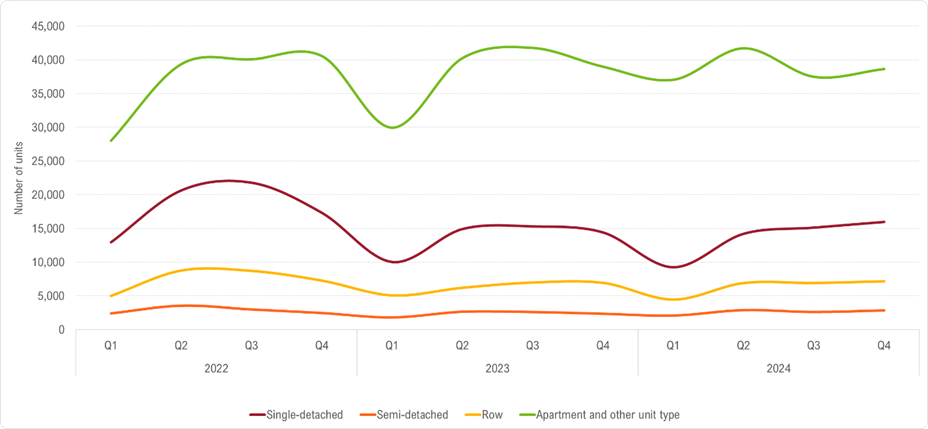
Source: Statistics Canada. Table 34-10-0135-01 Canada Mortgage and Housing Corporation, housing starts, under construction and completions, all areas, quarterly
Construction of single-detached had a weak start to the year, as interest rate cuts did not begin impacting new construction until later in the year. However, the easing of interest rates helped close the gap in the third and fourth quarters of the year, leading to only a modest year-over-year decline from 2023.
Nation-wide, nearly 10,500 semi-detached units were started in 2024, representing a strong recovery from lows seen in 2023. The 11% year-over-year growth returned starts for this unit type to just over 2019 levels, but below the highs seen between 2020 and 2022.
Row-housing construction has seen strong gains in some provinces, such as in the Prairies, but continues to account for a relatively smaller portion of total housing starts. Canada-wide, the growth in this unit type was more muted given declining trends in some provinces – British Columbia and Quebec in particular.
Activity rose in some parts of the country, and fell in others
Regional activity varied significantly across the country, as some markets bounced back quickly while others continued to cool.
Edmonton (+39%), Calgary (+24%), and Montréal (+15%) led the charge, alongside remarkable growth in mid-sized markets like London, Ontario (+91%) and Québec City (+38%). These cities benefitted from a combination of improving affordability, pent-up demand, and in some cases, favourable local policies that eased construction timelines.
Meanwhile, Canada’s two largest metropolitan areas – Toronto and Vancouver – experienced sharp pullbacks. Toronto saw housing starts fall by 20%, while Vancouver declined 15%. Other Ontario metropolitan regions followed suit, with Hamilton (-29%), Kitchener-Cambridge-Waterloo (-28%), and Ottawa-Gatineau (-15%) all seeing substantial drops. Rising construction costs, high land prices, and a glut of inventory in some pockets likely contributed to this cooling.
At the margins, smaller centres punched far above their weight. Places like Prince George, British Columbia (+177%), Medicine Hat, Alberta (+151%), Lethbridge, Alberta (+146%), and Greater Sudbury, Ontario (+144%) more than doubled their housing starts from 2023. These sudden spikes, while promising for housing supply, can challenge the capacity of local labour markets, especially when skilled trades and construction services are already in short supply.
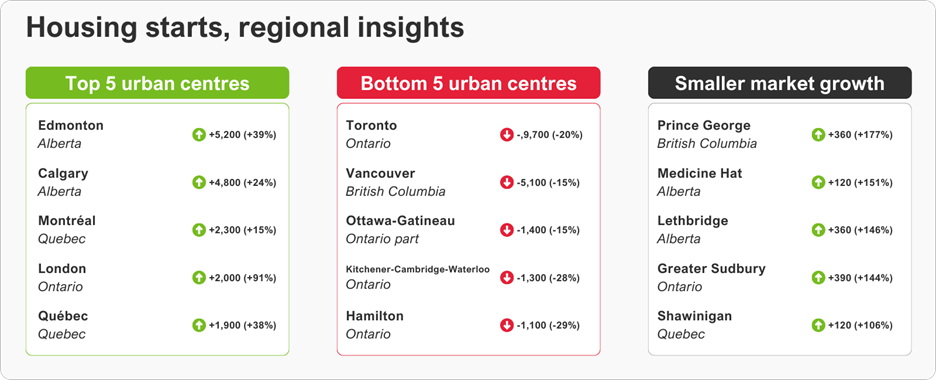
Note: the graphic above shows the 2023 to 2024 year-over-year change, in real terms and percentage, for select major urban centres across Canada.
Source: Statistics Canada. Table 34-10-0148-01 Canada Mortgage and Housing Corporation, housing starts, by type of dwelling and market type in centres 10,000 and over, Canada, provinces, census metropolitan areas and large census agglomerations
Under construction: a growing pipeline, but completions lag
Even as starts began to recover, it’s the volume of homes under construction that has quietly become one of the most significant stories in Canadian housing. That pipeline has grown considerably over the past decade. From an annual average of 646,000 units under construction between 2000 and 2015, recent years have seen that number almost double – averaging closer to 1.2 million units between 2018 and 2022.
In 2022 (latest year data is available), that trend continued – with over 1.4 million units under construction Canada-wide. The share of housing units currently under construction remained elevated based on latest data, accounting for 75% units started, completed, and under construction (up from 64% in 2010). This shift indicates that while starts are recovering and new supply is underway, bottlenecks in labour, permitting, supply chains, and a shift toward high-rise apartments may be delaying completions.
That’s a critical concern. Housing completions have remained surprisingly stagnant over the past two decades. Between 2002 and 2011, completions averaged 199,000 units annually. From 2012 to 2022, that average slipped slightly to just 195,000 despite surging population growth and intensifying housing demand. In 2022, close to 220,000 units were completed. In other words, while Canada is building more, it’s not necessarily delivering more completed homes to market at the pace needed.
Demographics matter, and they’re changing
Although immigration remained strong in 2024 – particularly among permanent residents – the broader trend in population growth began to cool as net non-permanent residency declined by 64% year-over-year. As net non-permanent residents turned negative by the fourth quarter of 2024, it marked a turning point after the unprecedented growth of 2023.
For the housing sector, this shift is important. Population growth fuels housing demand. When it slows, particularly in major urban centres that attract a high share of temporary residents, it softens near-term demand for new builds. However, with over 480,000 permanent residents and over 291,000 net non-permanent residents added in 2024, long-term housing needs remain robust, especially when accounting for the undersupply of affordable housing across the country.
What the numbers mean for builders and policymakers
The residential sector’s modest recovery in 2024 was driven by improved financing conditions, evolving housing preferences, and targeted incentives. But it also revealed deeper structural challenges such as regional disparities, project bottlenecks, and persistent lags in completions.
For builders, the message is clear: demand is there, especially in mid-sized markets and the rental segment. But navigating this recovery requires flexibility, long-term planning, and a keen eye on local capacity. For policymakers, the lesson is equally stark: delivering on housing affordability and availability goals requires not just supporting starts, but accelerating the path to completion.
For more information about these trends, click through to our 2025 to 2034 Construction and Maintenance Looking Forward highlight reports. And watch for part three of this blog series, scheduled for release in July, where public infrastructure investment, major project pipelines, and regional priorities are driving a very different kind of construction momentum.
Construction Key Indicators