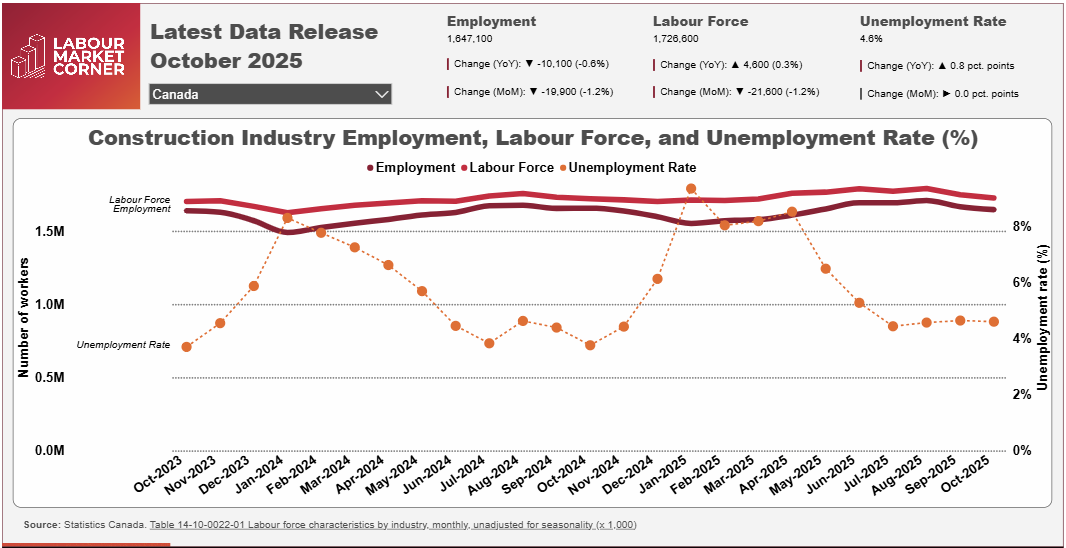
Construction employment contracted by 0.6% over the 12-month period ending in October 2025, while the labour force (those employed and those seeking employment) rose by 0.3%.
The latest Labour Force Survey data from Statistics Canada finds construction employment down slightly (-0.6%) between October 2024 and October 2025, while the labour force increased marginally (+0.3%). As a result, the national construction unemployment rate increased from 3.8% to 4.6%.
Overall employment declined among both men and women over the last 12 months, with the former contracting by 0.5% and the latter by 1.0%. A closer look at the numbers, however, reveals that employment increased among workers in the youngest age cohort – i.e., those aged 15 to 24 years – by 0.7%. The rise was exclusive to employment among young men (+1.8%) while employment among young women declined by 9.6%.
Among the core-aged group of workers (i.e., those aged 25 to 54 years), employment was virtually unchanged at +0.1%. Gains were exclusive to core-aged females, where employment rose by 7.1%. Among core-aged males, employment contracted by 0.9%. Employment among the eldest worker cohort – aged 55 years and over – contracted by 3.9% overall.
October’s employment data is somewhat in line with trends seen in the value of building permits data. For the 12-month period ending in September 2025, building permit values are 7.5% lower across the country, with contractions reported in four of the five sub-sectors – mostly notably in institutional building construction (-43.6%) and industrial building construction (-15.0%). Only commercial building construction recorded an increase (+10.0%) over the same period.
However, care must be taken in comparing the value of building permits (in nominal dollars) to employment trends as the data that Statistics Canada makes available does not make it clear whether these declining values are a matter of declining activity levels, lower prices, advanced building practices or increased labour productivity which could reduce the cost of building. This is especially complex based on the fact that the number of building permits increased (+3.2%) in September, which could mean the country is building more projects of smaller scope or any of the reasons given above.
The decline in building permit values may be driven by a number of trends. The year-over-year slowdown in industrial building may be tied to the ongoing economic uncertainty created by tariff disputes between Canada and the United States, and their resulting impact on investment in manufacturing-building construction in particular. Similarly, the reduction in residential building permits (permits for single-family dwellings were down 2.2% while permits for multi-unit dwellings were down 3.5% year over year) may be driven by weakened consumer confidence, especially around the timing of renovation projects, as well as ongoing concerns over housing affordability, and excess supply conditions in the Toronto and Vancouver census metropolitan areas.
Across the country, five provinces saw construction employment increase between October 2024 and 2025. British Columbia reported the largest absolute increase at +14,900 workers, or +6.1%. Saskatchewan (+4,400 workers, +9.6%) and Manitoba (+3,600 workers, +6.1%) followed, with Alberta and Newfoundland and Labrador each reporting increases of less than 1,000 workers.
British Columbia in particular has reported a notable increase in building permit activity for the 12-month period ending in September 2025. Values have increased by 53.0% year over year, with significant increases in the industrial (167.9%), commercial (+194.4%), and institutional (+91.2%) sub-sectors. These gains are tied to a long-list of major projects across the province’s non-residential construction sector, including two major liquefied natural gas projects and several long-term care and healthcare facilities. Although permit values in the province’s residential sector were also elevated year over year, total housing starts were 15.9% lower over the same period, with notable contractions in starts for row-housing (-29.9%) and apartment (-18.6%) units.
Conversely, Quebec reported the largest absolute employment decline year over year (-20,500 workers; -5.8%), with Ontario (-7,900 workers, -1.3%), New Brunswick (-3,200 workers, -8.6%), and Nova Scotia (-2,700 workers, -5.7%) following. Prince Edward Island reported a contraction of -100 workers, or -1.0%. Quebec’s downturn in employment in October accounted for more than half of the total construction employment lost nationally, year-over-year (-10,200 workers), and is likely due to the conclusion of a number of significant projects in the institutional, manufacturing, and utilities sectors earlier this year, including the Eeyou-Eenou Regional Health Centre, the Varennes Carbon Recycling facility, and Hydro Quebec’s Hertel-New York interconnection line.
For October 2025, construction unemployment rates across the provinces varied from a low of 2.6% in Manitoba to a high of 9.8% in Newfoundland and Labrador. Most other provinces reported rates of between 3% and 5%.
Finally, with ten months of LFS data now complete, we can start inferring how the year will close for Canada’s construction industry.
While nationwide demands ebbed in September, they posted growth in every other month in 2025. As a result, year-to-date (January through October) employment is up some 32,400 (+2.0%) workers. Labour force growth, meanwhile, has outpaced employment – growing by 48,400 (+2.8%) workers, resulting in an increase in unemployment rates to an annual average of 6.4% year-to-date (from 5.6% between January through October in 2024).
Year-to-date, most provinces experienced employment growth, with Newfoundland and Labrador (-8.4%), New Brunswick (-5.9%), Quebec (-1.8%), and Ontario (-0.1%) being the exception. Growth has been strongest in Saskatchewan (+13.4%), Prince Edward Island (+9.6%), and Alberta and British Columbia which have both posted year-to-date employment growth of about 6.5%.

Construction Key Indicators